End-to-End Monitoring of Azure Functions with Application Insights
15 Dec 2017 • 5 min readAs you already know, since April 6, 2017 Azure Functions has direct integration with Application Insights.
One of the already know issues is that dependencies that the function has to other services don’t show up automatically.
But with some manual work, it’s possible today!
Current limitations
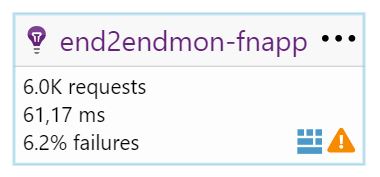
More importantly you are currently not able to have a full end-to-end monitoring experience if you chain multiple Azure Functions together e.g. per HTTP or queues.
Let’s asume you have the following simple scenario:
- TimerTrigger Function
- Calls at 50% to HttpTrigger
- HttpTrigger Function
- Throws at 10% an Exception
- Enqueue at 50% a message into Storage Queue
- QueueTrigger Function
- Throws at 10% an Exception
Currently you will only see the following:
Also all telemtry is not correlated, so you cannot trace any event end-to-end.
What’s possible today?
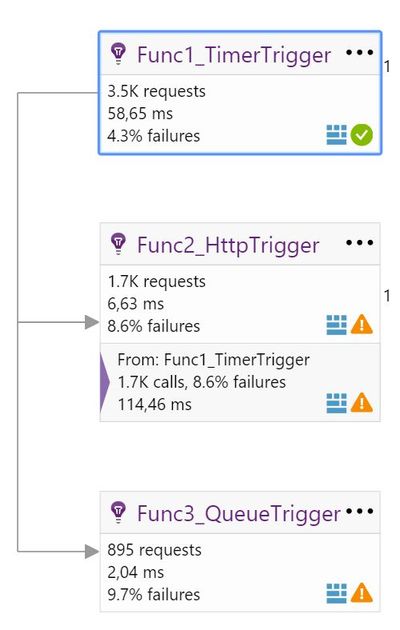
But let’s talk about what’s possible today: if you really need an end-to-end monitoring experience, just skip the integration right now and do it manually.
The result is beautiful:
Let’s take a look at the source code
You can find the full sample source code at https://github.com/RicardoNiepel/azure-functions-end2end-monitoring.
The sample is on C#, but there are also Application Insight SDKs for a long list of other languages/platform: Java, JavaScript, NodeJS, PHP, Python, Ruby…
Take a look at Developer analytics: languages, platforms, and integrations to find the right SDK in your situation.
The general idea of this sample can also be applied with the other Application Insight SDKs.
There are several very important things to make this possible:
Disable automatic Application Insights integration
The first thing you need to ensure is, that the normal Application Insights integration with Azrue Functions is disable, otherwise you will have a lot of duplicated telemetry.
The automatic integration uses the specific application setting key “APPINSIGHTS_INSTRUMENTATIONKEY” - just don’t use this one. I have used “APPINSIGHTS_INSTRUMENTATIONKEY_CUSTOM” instead.
It is also possible to use two distinct Application Insights instances/keys - one for the automatic integration, one for the end-to-end monitoring.
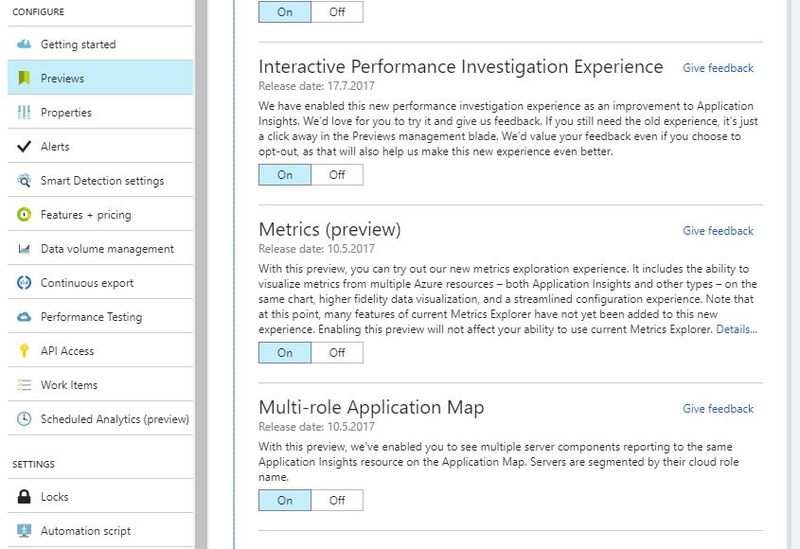
Enable preview of Multi-role Application Map
For seeing an Azure Functions End-to-End System Map you need to enable the preview feature of “Multi-role Application Map”:
Setting Cloud_RoleName
To show up each Azure Function as a seperate sub-system inside Application Insights, it’s important to set Cloud_RoleName at each telemetry you are sending.
I’m ensuring this at each Azure Function with the line
_telemetryClient.Context.Cloud.RoleName = context.FunctionName;
Send Request Telemetry
Send for each Azure Function execution a request telemetry to Application Insights. In this situation a request is not only a HTTP request, it’s also a timer execution, a queue item processing and so on…
More info can be found at Request telemetry: Application Insights data model.
Send Dependency Telemetry
If you want that all dependencies also show up correctly at Applicaiton Insights and you are able to see slow dependencies and dependency failures, you should also track each depenedency.
Currently the automatic discovery of dependencies like HTTP or SQL calls - as you know it from ASP.NET applicaitons for example - is not supported at Azure Functions. So you need to do this also yourself.
More info can be found at Dependency telemetry: Application Insights data model.
Correlation
The last important thing - maybe the most important one - is the correlation of each individual telemetry you are sending.
You will have an Operation ID for the whole operation - on all stages / sub-systems - which needs to be handed over from Azure Function to the next Azure Function. You also need to set the last Telemetry ID as the current Parent ID.
Here is the code which hands over the ID through an HTTP header:
// Func1_TimerTrigger.cs
var requestMessage = new HttpRequestMessage(HttpMethod.Get, url);
...
requestMessage.Headers.Add("Request-Id", operation.Telemetry.Id);
response = await _httpClient.SendAsync(requestMessage);
Application Insights creates a new Operation ID for us, if we don’t set one. Thus at the first request, it’s generated for us.
Behind the scenes Application Insights uses a Hierarchical Request-Id as Operation ID.
This means for us, we only need to transfer the Hierarchical Request-Id and both, the Operation ID and the last Telemetry ID can be extracted from these.
// Sample of Request-Id = |YycSvZk4c18=.5998b4f5_1.
// Extracted Operation ID = YycSvZk4c18=

// Func2_HttpTrigger.cs
if (req.Headers.ContainsKey("Request-Id"))
{
    var requestId = req.Headers.GetCommaSeparatedValues("Request-Id").Single();
    requestTelemetry.Context.Operation.Id = CorrelationHelper.GetOperationId(requestId);
    requestTelemetry.Context.Operation.ParentId = requestId;
}

// CorrelationHelper.cs
public static string GetOperationId(string requestId)
{
    // Returns the root ID from the '|' to the first '.' if any.
    // Following the HTTP Protocol for Correlation - Hierarchical Request-Id schema is used
    int rootEnd = requestId.IndexOf('.');
    if (rootEnd < 0)
        rootEnd = requestId.Length;

    int rootStart = requestId[0] == '|' ? 1 : 0;
    return requestId.Substring(rootStart, rootEnd - rootStart);
}
Now we are done with having an End-to-End monitoring of our Azufe Functions.
In this sample we only used an HTTP trigger and a Queue trigger - if you also want to use other triggers, make sure to send the right telemetry for thin kins of dependencies.
More info can be found at Track custom operations with Application Insights .NET SDK
Next steps
Start by cloning my repro azure-functions-end2end-monitoring, use it in your current project and take a look at some background information:
- Monitor multi-component applications with Application Insights (preview)
- End-to-end system app maps
- Application Insights telemetry data model
- Telemetry correlation in Application Insights
- Track custom operations with Application Insights .NET SDK
- Two Types of Correlation
- HTTP Protocol proposal - HTTP Correlation Protocol
- HTTP Protocol proposal - Hierarchical Request-Id


